To find a suitable data store we've decided to setup a test. We created a data model and imported the data in some data stores to see how they behave and what resources they will need. We used following data stores for the test:
- Apache Cassandra
- MongoDB
- TokuMX
- Two import machines (8 core, 32GB RAM, 1GbE Network, index service)
- Four data store machines (8 core, 32 GB RAM, 1GbE Network, each with all three data stores installed)

According to each system the data model was corresponding. Two column families for Apache Cassandra and one document model for MongoDB/TokuMX. The data model is aligned with the later queries and both strategies (Cassandra and MongoDB/TokuMX) can be used by just switching a config flag. This means, the query application is built to support both ways for better comparison. The importer/indexer service itself is a component responsible for reading (File over NFS), parsing (JAXB) and writing (NoSQL) the data. It is built on akka.io so we can tune concurrency.
First Steps
After fiddling around with concurrency we found the settings to fit the best. We imported some 10 GB's of raw data. In the first place we used virtual machines to host the data stores. We found out soon that the used systems do not suffice for our test needs. Therefore we switched to hardware servers. That's something we can talk now.
System layout Apache Cassandra
Since Apache Cassandra nodes are all equal (in their role), there is not much to say. We use replication factor 2 to prevent data loss.
System layout MongoDB/TokuMX
Both databases are set up as shared/replicated cluster, 4 replica sets (every server carries a master and a slave of a different replica set), 3 config servers (server 1 through 3 carry a config server in addition to the shard server instances) and 3 sharding router (mongos).
The test
After moving to real hardware we increased our data amount to 100GB. When starting the test first, we ran out of memory on our application servers. The massive file load killed our machines. After increasing the memory we could watch the system working. After a while we increased our data chunk to 100GB. The load on the application servers was in the upper 90% for all cores. This is a optimal utilization of the CPUs without having too much I/O waits. The importer process decouples I/O intensive work so NFS reading is not synchronized with XML parsing or NoSQL writing. Each of these processes have their own queues. After some test series we've found out that:
- The NoSQL data stores are not a limiting factor
- The storage cache has massive impact on how fast the data is available (6ms cached vs. 50ms not cached)
- The network is our limit
NoSQL performance We are writing to the NoSQL data stores using 20 threads on each application server (40 in total). The more threads we add the more throughput we achieve. We did not hit the point where adding more workers slows down the system. The particular data stores have different response times and draw different pictures of system load.
Response Times for writing a batch of data
| Apache Cassandra | MongoDB | TokuMX |
|---|---|---|
| 81ms | 21ms | 17ms |
 |
| Write latency |
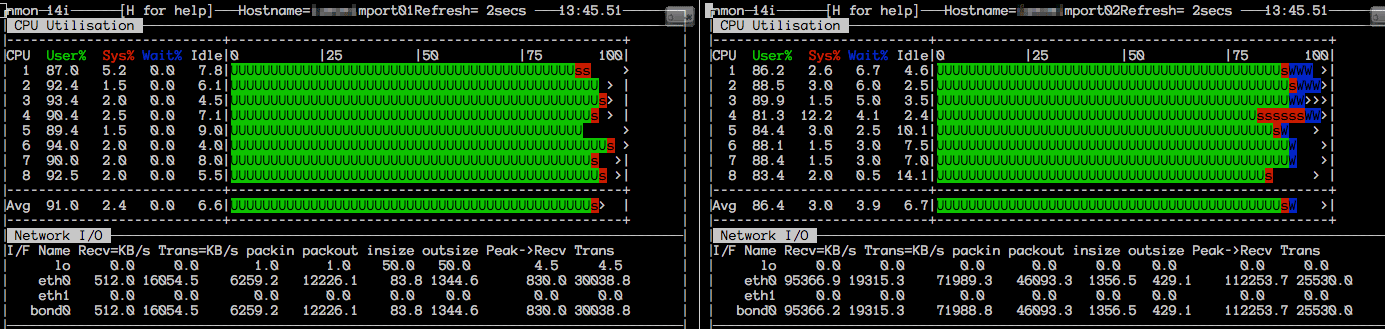
When our tests were running, we achieved some 103MB/sec on inbound traffic (NFS read of XML files, measured on the network interface) and 20MB/sec outbound (write the data into the NoSQL data store). This was mostly when only one importer node ran. As soon as both nodes were working, inbound traffic rates dropped between 500MB/sec to 70MB/sec. Adding more nodes/workers caused not a higher throughput but rather the available network bandwidth was shared amongst the importer nodes. The storage performance remained stable.
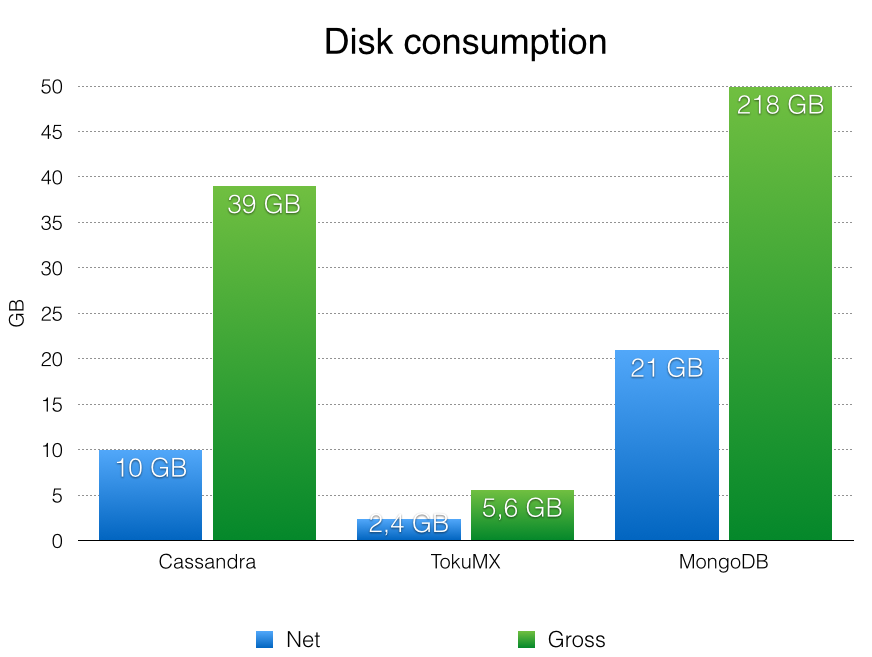
Data size of the NoSQL data stores
After running the imports we measured the disk usage of the NoSQL data stores. This is an important metric for us to estimate our hardware needs. We differentiate between the net data size (usage of the column families within keyspace/collections within the database) and the gross data size (keyspace/database with oplog/commit log)
| Apache Cassandra | MongoDB | TokuMX | |
|---|---|---|---|
| Net | 10 GB | 21 GB | 2,4 GB |
| Gross | 39 GB | 218 GB | 5,6 GB |
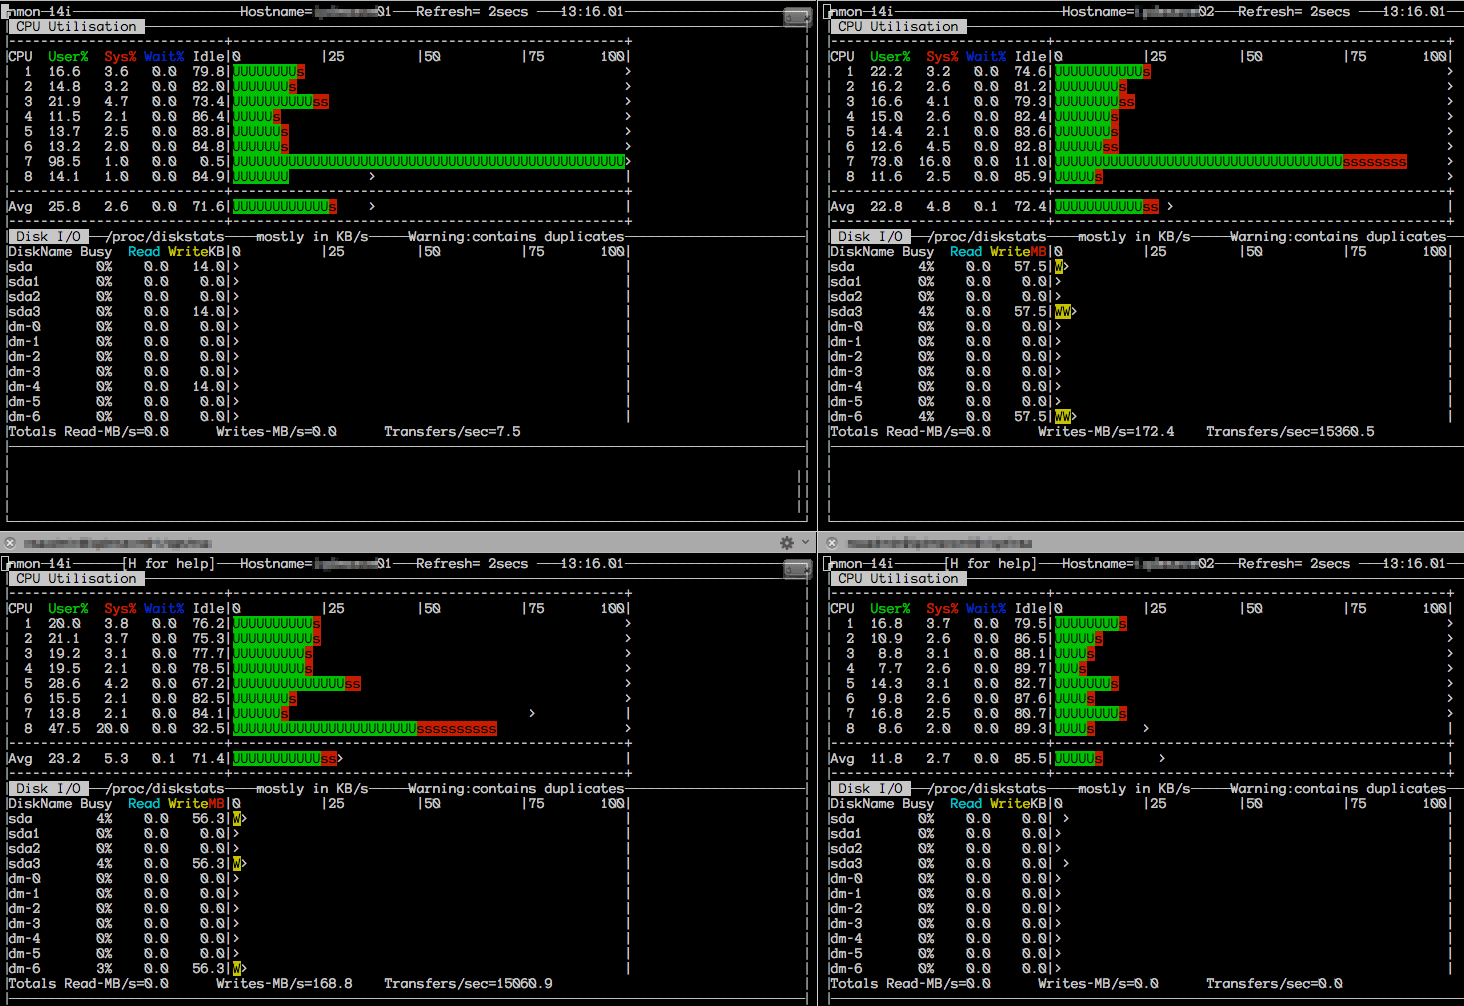
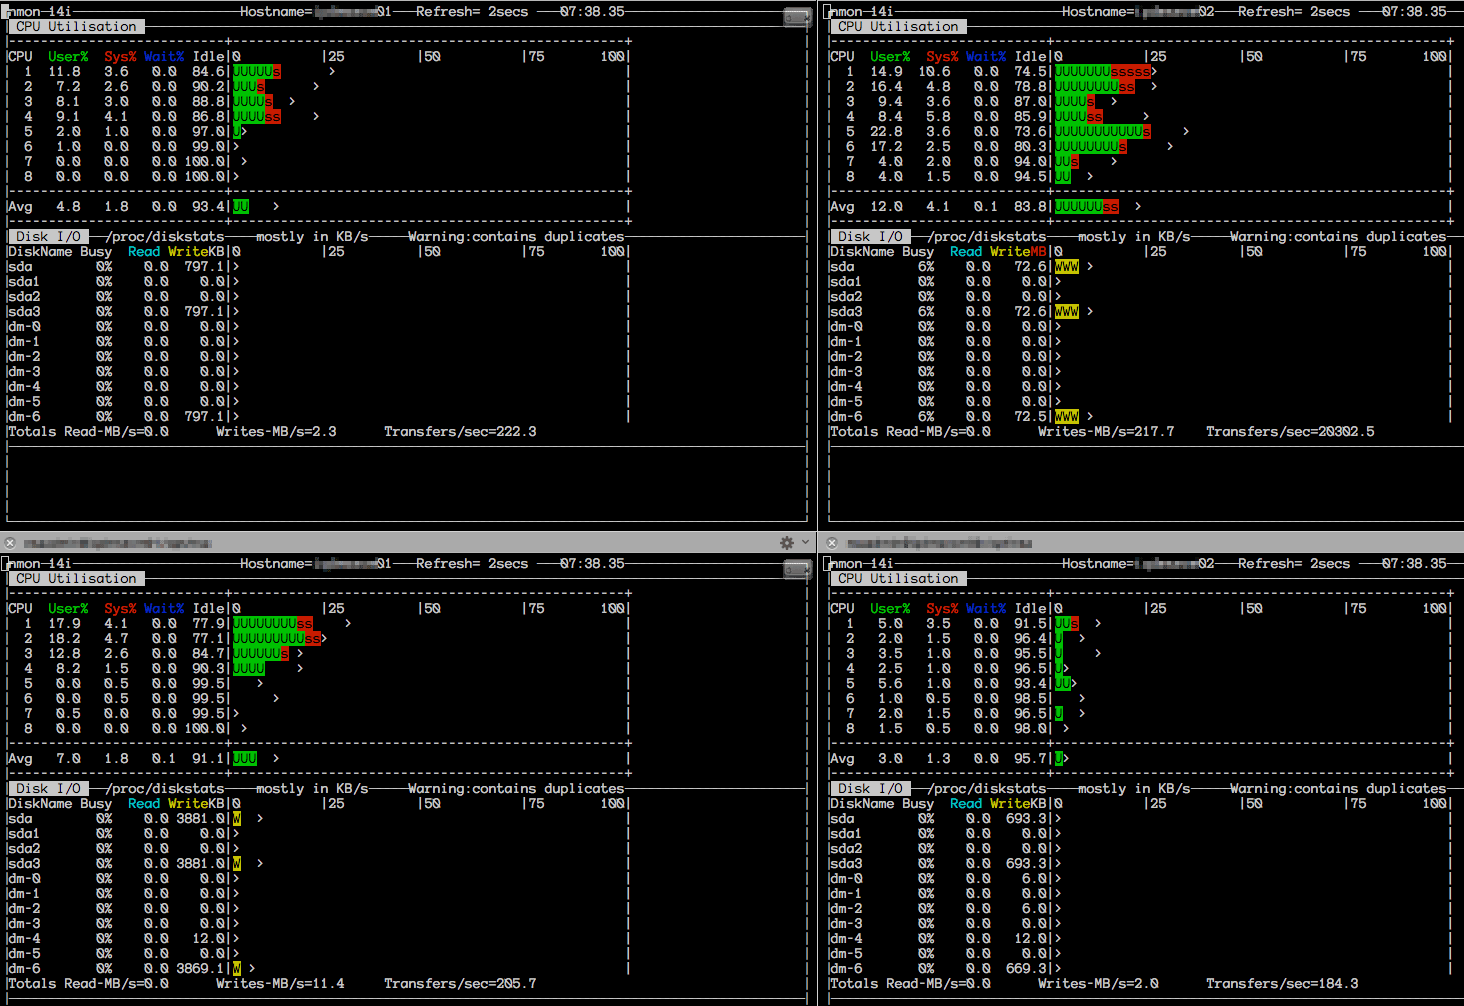
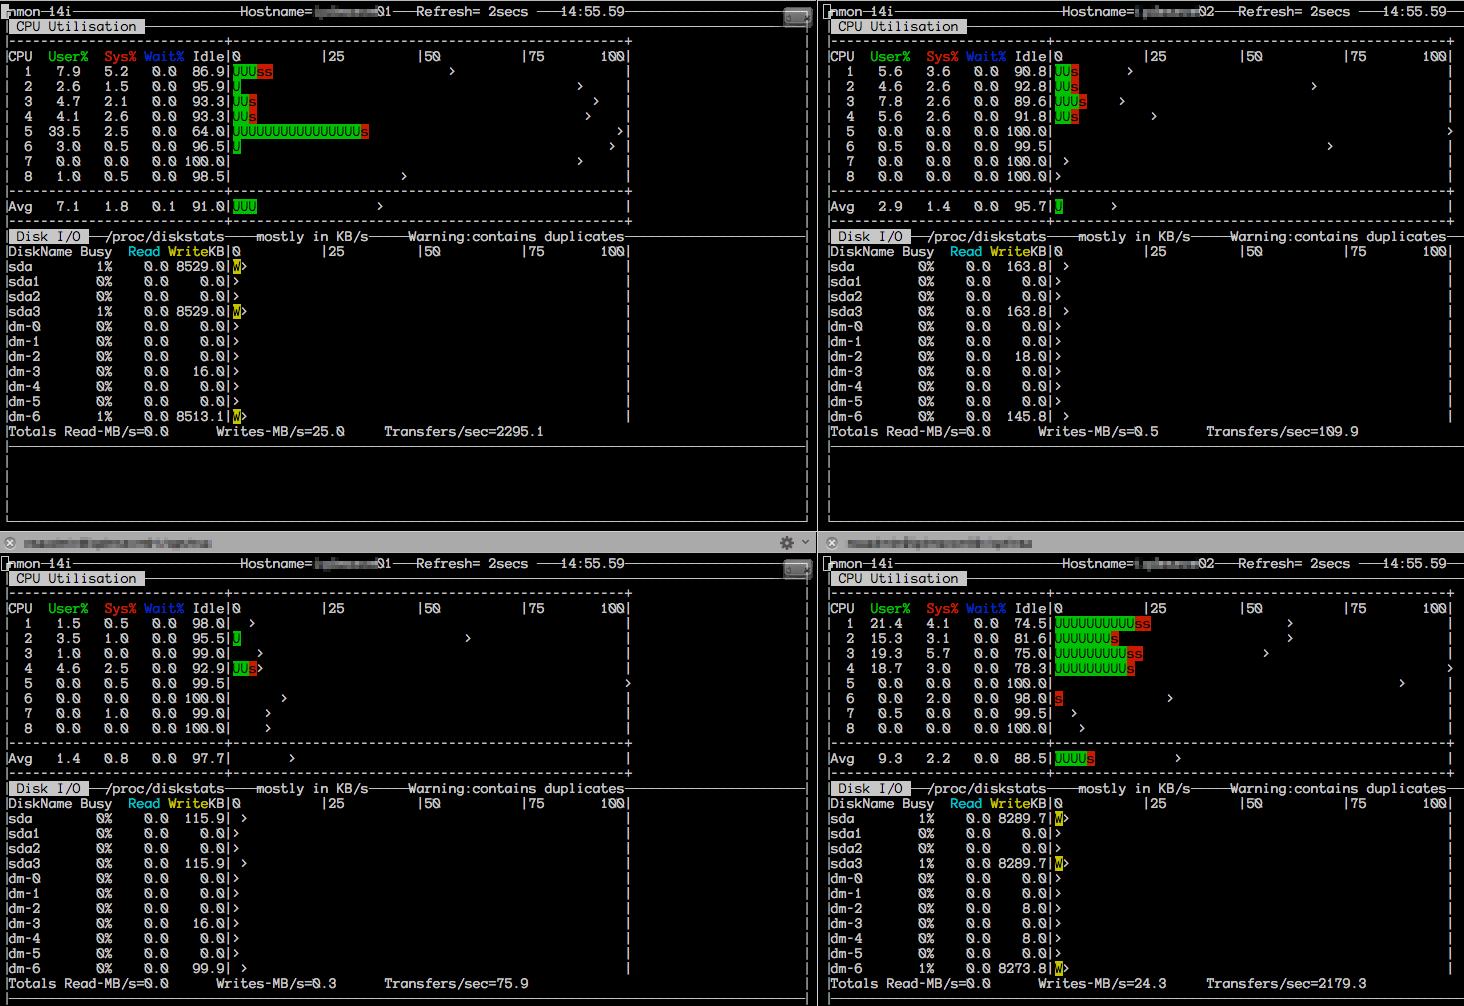
Here are some monitoring snapshots while the import was running
nmon on the Data Store Servers
 |
 |
| Apache Cassandra | MongoDB |
 |
|
| TokuMX |
nmon on the Importer Server (Application Server)
 |
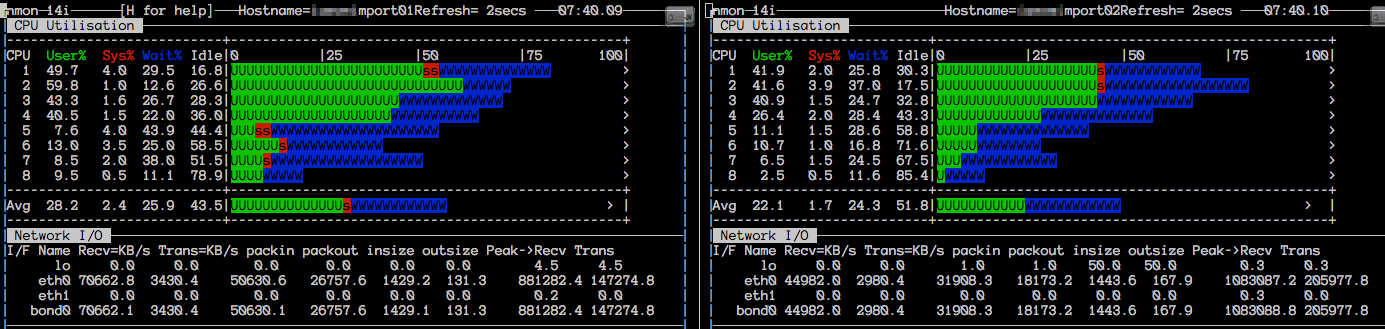 |
| nmon Snapshot 1 | nmon Snapshot 2 |
 |
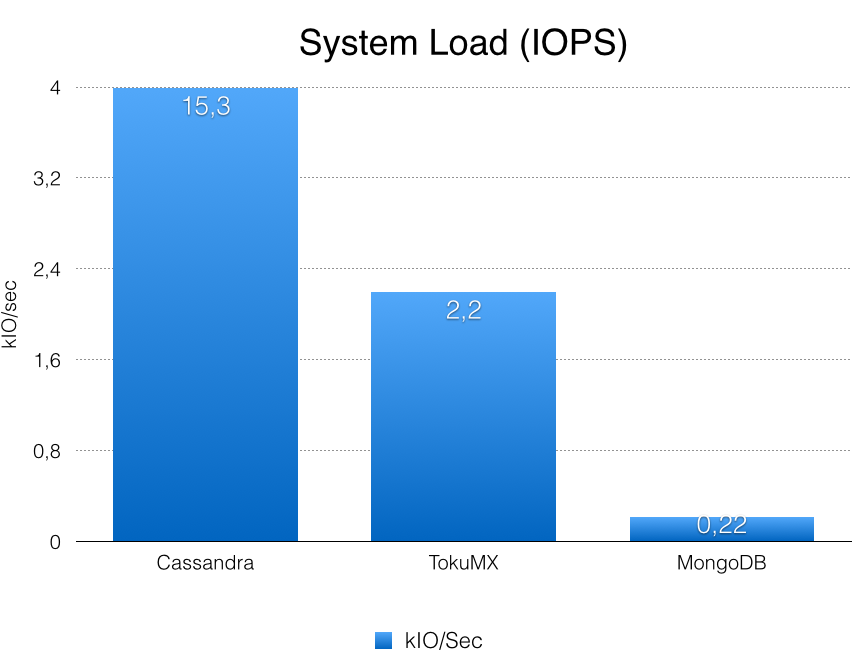 |
| Disk Consumption | IOPS |
 |
 |
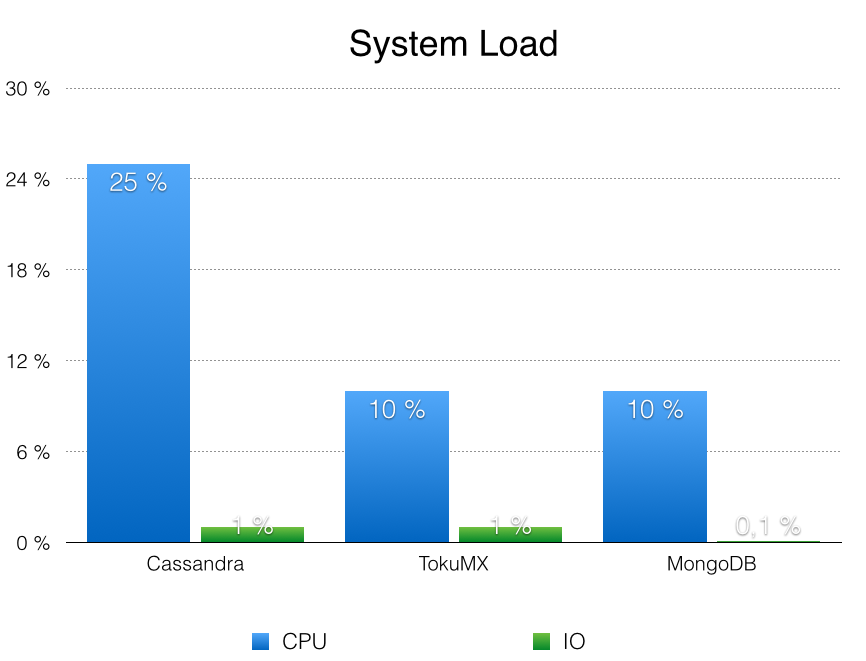
| System Load | nmon System details |
Used versions
- Apache Cassandra 2.1.0
- MongoDB 2.4.12
- TokuMX 2.0.0
Lessons learned
We learned a lot about our setup. We have now a feeling how our components behave when putting load on them. The most surprising insight is the network limit factor. Hope we can convince some network engineers to improve our setup so we can stress the NoSQL data stores. In the current results the NoSQL systems seem quite bored to me. It is amazing to see the system under load and to see that the application utilizes the hardware in a such an efficient way.